
OPTICAL ENGINEERING PAGE
MIRROR CLEANING:
Since the beginning of the year 2000, we have implemented a program of regular washing (every 6 months) of the primary mirrors of the 4m, 1.5m and 0.9m telescopes. The results are so good that we are now planning to aluminize these mirrors every 4 years only (instead of every 2 years up to now). The 4m M1 is washed in-situ with a system of inflatable seals. We are able to peform the operation in a minimum amount of time (typically 2-3 hours at the 4m) without specific engineering time scheduled. Since August 2000, we are also using an IRIS 908RS device to measure scattered and reflected light from the mirrors (the IRIS replaces the Minolta instrument). In August 2000, we have also installed a grounding cable for the 4m M1 coating in the hope to minimize the accumulation of dust by electrostatic attraction.
Besides, we perform fortnightly C02 snow cleaning of the 4m and 1.5m primary mirrors. The secondary mirrors keep clean much longer and are typically cleaned with CO2 twice per year.
- Facts summary slide show presented at the 2001 Mirror cleaning and coating conference (Palomar Observatory)
- Notas tomadas durante la conferencia (en castellano)
- Mirror cleaning with C02
- IRIS 908RS reflectometer/scatterometer operation manual.
- Minolta reflectometer instructions for downloading the data to a PC
- Calibration difficulties between the old data taken with the Minolta and the new data taken with the Iris. See notes at the end of this document.
- Reflectometry at the 4m Victor Blanco telescope
- Reflectometry at the 1.5m telescope
- Reflectometry at the 0.9m and Schmidt telescopes
- Reflectivity of Al, Ag and Au. For bare Al coating: 92.1% (470nm), 91.6% (530nm), 90.5% (650nm) and 88.0% (880nm). Data from Hass G., 1965, Applied optics and optical engineering, ed. Kingslake, Academic Press, New York, vol. III, p309
- Calendar (1975-now) of aluminizing and washing
- Washing procedures at smaller telescopes
- Blanco R & S follow-up (Excel file)
- Blanco 4m Reflectivity follow up_January 2010 (PDF file)
SMALL TELESCOPES:
MIRROR ALUMINIZING:
THERMAL ISSUES:
- Where to find useful logs? Temp4m logs are stored in /ut02/seeing/temper/data/. Weather logs are stored in /ut02/seeing/weather_data/ (data prior to 1998 is still lost...). Site seeing logs are stored in /ut02/seeing/seeing_data/. The focus log at PF is /ut02/seeing/focuslog. The old 4m tel side port seeing camera log is /ut02/seeing/jacoby.log.
- Memo (18Oct99) describing the revised operation instructions at the 4m for image quality program (includes seeing measurements, thermal environment,...)
- Is the mirror going to be wet? (check the risk of condensation)
- Primary mirror cooling (active only during day-time, at night time we simply reverse the system and extract air to prevent hot air bubles to form above the mirror). The 15 tons of Cervit have a large thermal inertia, but we can typically cool its surface by 0.75deg/hour by blowing 6deg cooler air around it. The control algorithm is rather simple as it is based on the fact that usually the dome temperature will reflect well the variations of the outside temperature, thus by keeping the mirror 2deg colder than the low dome during the day, we start the next night in optimum condition. The typical night time pattern is for the outside temperature to drop slowly and cross the mirror temperature at about 2/3 of the night to finish some 0.5deg colder at morning twilight. This graph shows statistics of the difference between mirror and low dome temperatures.
- Temperature sensors (sensor list and some debugging hints for Temp4m)
- Last improvements in the 4m dome for optimizing thermal environment:
- The old console room walls were removed to open the direct pass of air flow blowing from the lateral doors into the dome (whenever the dome azimut is such that they are behind the console). These walls were 10m long. (March 2000)
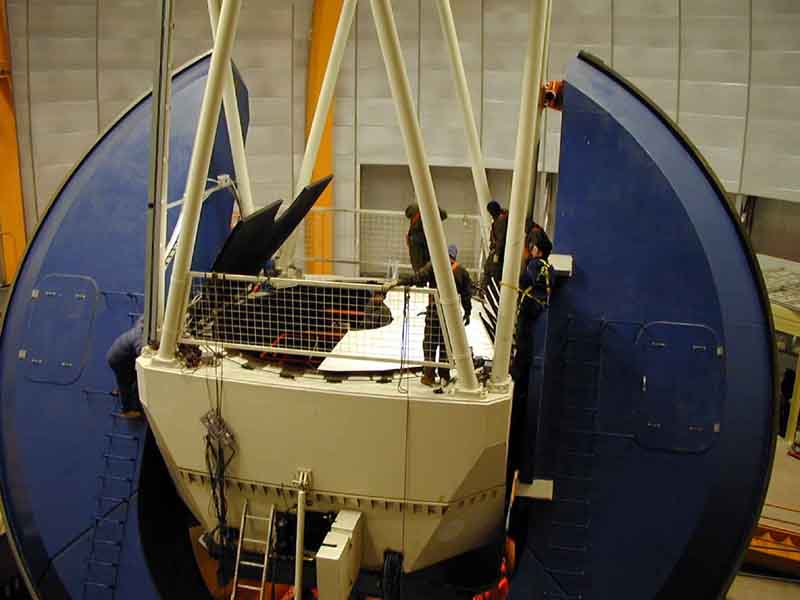
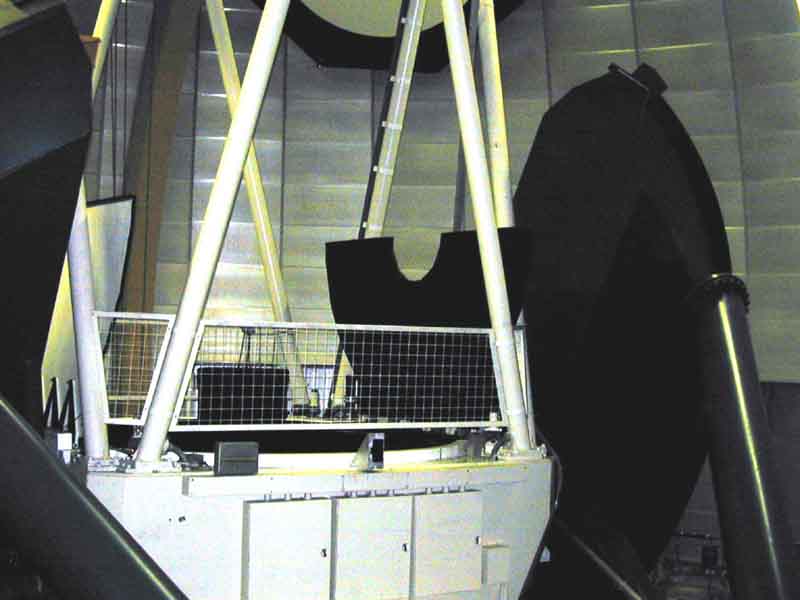
- The old mirror cover made of 24 petals opening up and forming a cylinder about 1.6m high (thus putting the mirror surface at the bottom of a 3.5m 'hole') was replaced by a 2-petal design (see picture 1 and picture 2) opening up on the west and east side (just in front of the top ends of the horseshoe). This leaves free path to the air flow
along the north-south direction (at zenith) and provides better (closer) ventilation to the primary mirror. See picture. (August 2000)
- The dome is being covered with aluminium sticky foil (September-November 2000)
SEEING STATISTICS:
In the following, 'Night report' refers to the number selected by the observer in the night report among the proposed categories: <0.4; 0.4-0.6; 0.6-0.8; 0.8-1.0; 1.0-1.5; 1.5-2.0; 2.0-3.0; >3.0. Actually, I use and plot the average of these respective categories: 0.4; 0.5; 0.7; 0.9; 1.25; 1.75; 2.5; 3.0. The numbers usually reflect the wavelength of interest of the instrument used (i.e. for example f/14 night reports yield a seeing estimate at about 2 microns).
- Recent f/14 image quality statistics: histogram and night by night (18 nights from Dec99 to May00)
- Recent PF image quality statistics (Feb-Apr 00)
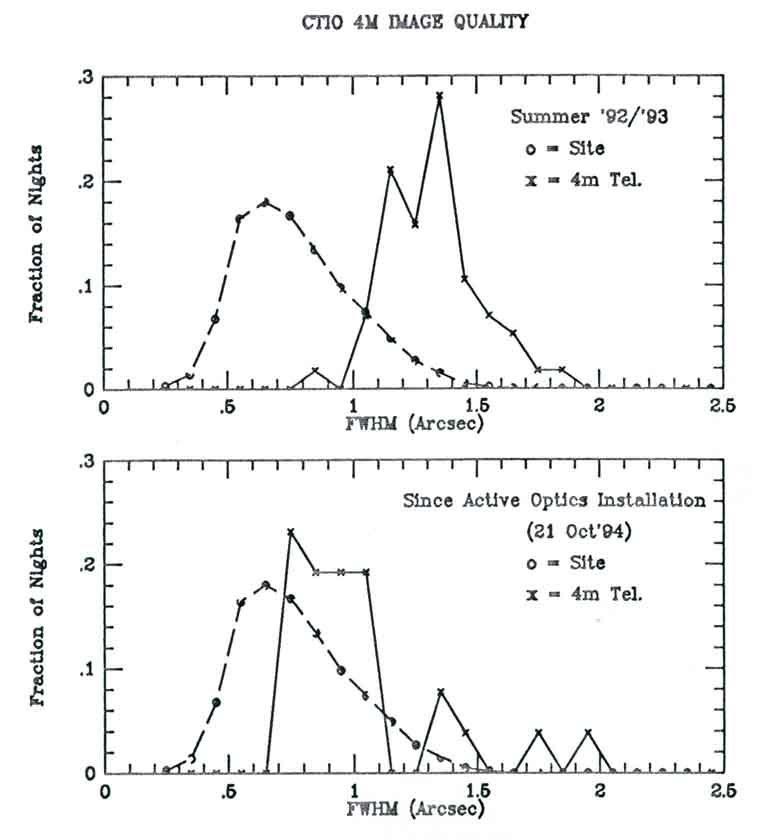
- 4m f/8 image quality statistics (corrected at zenith and 550nm, before/after active optics, 92 to 94, SPIE paper by Baldwin et al.)
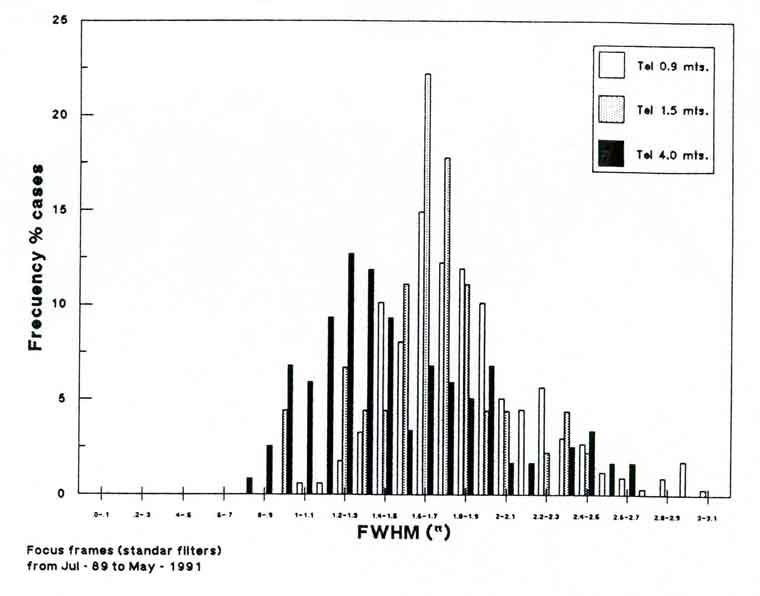
- Old Tololo image quality statistics (89-91 from Suntzeff, not corrected to zenith)
- FWHM seeing comparaison over 96-97-98-99 from the tower seeing monitor at Tololo. The seeing values are averaged over each calendar month (this is an arbitrary choice). Dots with a ? mean that the number of nights used to average was less than 15 during a single month, and the result isn't very reliable.
- FWHM seeing during 1996: year median is 0.56" (stdev = 0.28"). Percentiles: 10% at 0.35" and 90% at 1.00" (8034 samples)
- FWHM seeing during 1997: year median is 0.62" (stdev = 0.36"). Percentiles: 10% at 0.39" and 90% at 1.02" (4985 samples).
- FWHM seeing during 1998: year median is 0.85" (stdev = 0.45"). Percentiles: 10% at 0.40" and 90% at 1.37" (7853 samples).
- FWHM seeing during 1999: year median is 0.71" (stdev = 0.43"). Percentiles: 10% at 0.41" and 90% at 1.30" (9499 samples).
Note: all the seeing data presented above was taken with the Carnegie monitor. 9499 samples per year means an average of 26 per night, corresponding
to an average of 3 hours continuous sampling per night.
COLLIMATION AND 4M LOOKUP TABLES:
- Shapzz.help: instructions to reduce Hartmann data with Shap
- Instructions to make lookup tables
- In the following, all the wavefront aberration amplitudes mentionned for Zemax simulations are representing true Zernike polynomials, and the ones measured with the telescope are just similar, although called quasi-Zernikes.
- Latest astigmatism lookup table at F/8 (3-4 Feb 01); sky map at f/14 showed same aberrations thus the problem is likely to be bound to M1 and the lookup table is used at all foci.
- Latest trefoil lookup table at F/8 (3-4 Feb 01): constant vector (0.25um, 349deg); no aberration pattern seen at f/14 thus the problem is bound to the f/8 M2.
- Latest quadrafoil lookup table at F/8 (3-4 Feb 01): constant vector (0.17um, 191deg); sky map at f/14 showed same aberrations thus the problem is likely to be bound to M1 and the lookup table is used at all foci.
- SCALE OF THE WAVEFRONT ERRORS (optical path difference at the edge of the pupil): at the 4m, 0.1" image degradation is produced by 0.70um of coma, 0.30um of astigmatism, 0.26um of trefoil, 0.24um of quadrafoil.
- Records of old lookup tables
- Collimation procedure for the 1.5m telescope
- Collimation procedure for the 4m telescope at PF
IMAGE QUALITY AND INSTRUMENT PERFORMANCE:
- Guia práctica para evaluar calidad de imagen y aberraciones ópticas frecuentes (en castellano)
- 4M PF IMAGING:
- See here the as-per-design image quality at PF with MosaicII. This is based on diffraction encircled energy plots with the optical model in Zemax. Note the residual coma+trefoil pattern in the corners, well confirmed by the individual field aberration maps below. So far, to my knowledge, the best image achieved at PF with MosaicII (july 6th, 2000) had a fwhm of 0.54" (15sec, R filter). There are several other cases around 0.60" in long exposures.
- Residual field aberrations in the optical design of the PFADC: coma, astigmatism, trefoil, there is no quadrafoil left over, some small amount of 5th order terms). For reference, MosaicII CCD array is 123mm square. These maps are built with the Zernike coefficients delivered by Zemax. The quadratic sum of the 3 main aberrations in the corners sum up to a d80 = 0.48", rather close to the diffraction encircled energy d80 = 0.53" given by Zemax (see plot above). Note that the minimum coma field point is not the field center due to the assymmetry of the ADC prism angles (1.17 and 1.37deg respectively). A 5 arcsec tilt of M1 is required to zero the coma on-axis (see result). In theory, the effect of the ADC is only to produce a rotation of these patterns around the field center.
- Ellipticity measurements of Mosaic images.
- Depth of focus with Mosaic. You can deduce from this graph how well you need to focus initially and then watch out the temperature changes.
- See the effects of not using the ADC at different wavelengths and elevations on this plot.
- Infrared Side Port Imager (ISPI): spot diagrams in J band, H band, K band (fields are R, 0.85R, 0.70R, 0.50R, 0.35R and 0, where R is half the diagonal of the array). Diffraction encircled energy in J band, H band, K band. Through focus sequences in J band, H band, K band. Plate scale is 0.31 arcsec/pixel. Boxes are 2x2 pixels. No interband refocusing. Previous optimization (RMS spot size based) yielded the spot diagrams currently on the ISPI web page and the following EE at J band, H band, K band.
- SOAR Imager: spot diagrams, encircled energy and focus sequence. See presentation at the review.
2010 Blanco 4m Optical Status
2009 Blanco 4m SHUTDOWN:
OTHERS:
------------------------------------------------------------------------------
Last updated on 14th of July 2010
dholck@@ctio.noao.edu