


f/13.5 binned 2x2
We had three nights with the 1.5m in November 2001 to provide local standards for the highz supernova fields. Kevin and Pablo did the observing. A summary of the data reduction can be found here.
The photometric calibration files can be found here for the filters: bvriu.clb , riv.clb , and rz.clb
There were significant problems with the data. The setup had a 2 1/16" diaphragm in the upper filter bolt. The flats and skies were clearly vignetted. A quick calculation shows that this is the wrong diaphragm.
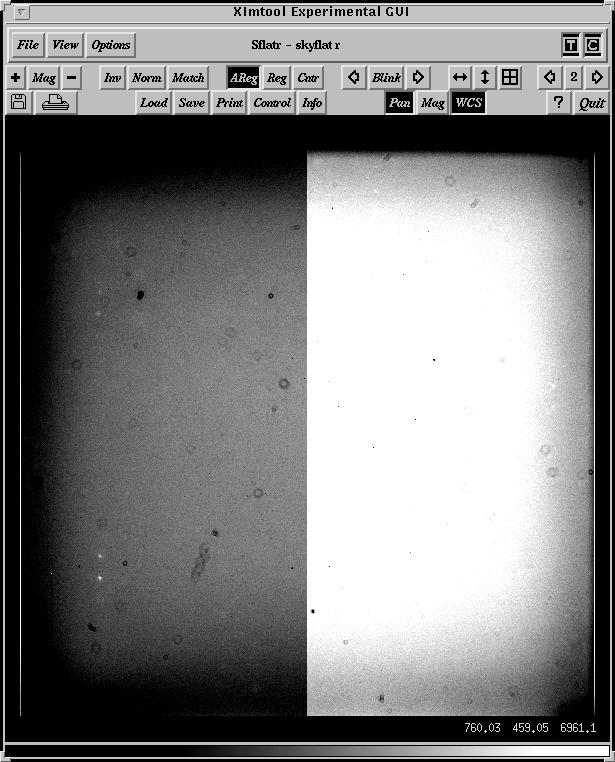
Here is an image of the sky flat in R taken on 9/10 Nov. Note the clear falloff of the light near the edges. From this image, we decided to extract the middle 750 pixels (binned 2x2, so we are really taking the middel 1500 physical pixels.
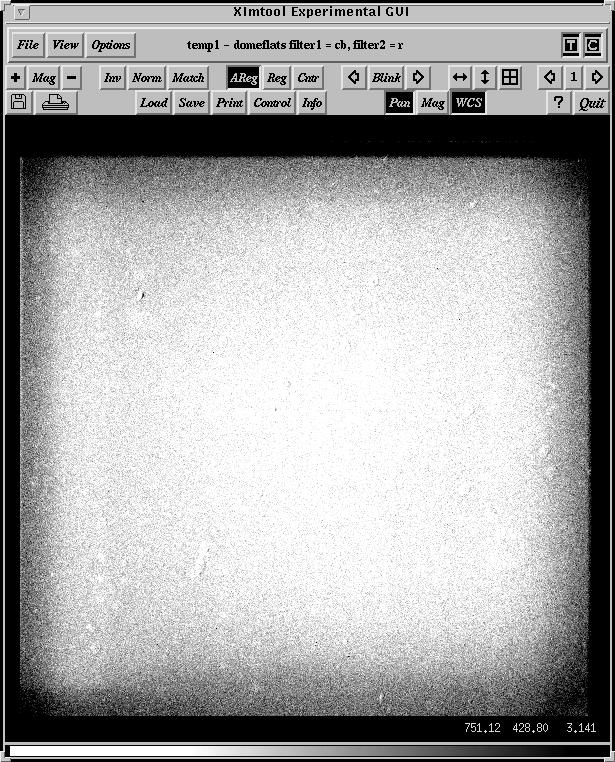
Here is an image of the dome flat divided by the sky flat across the full chip. The vignetting is also clear in this image.
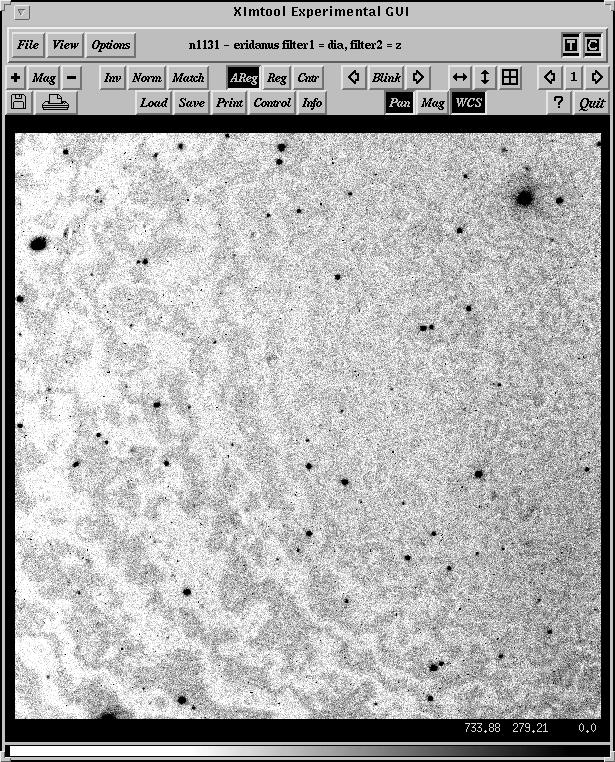
The "z" images showed fringing. Here is a typical z frame.
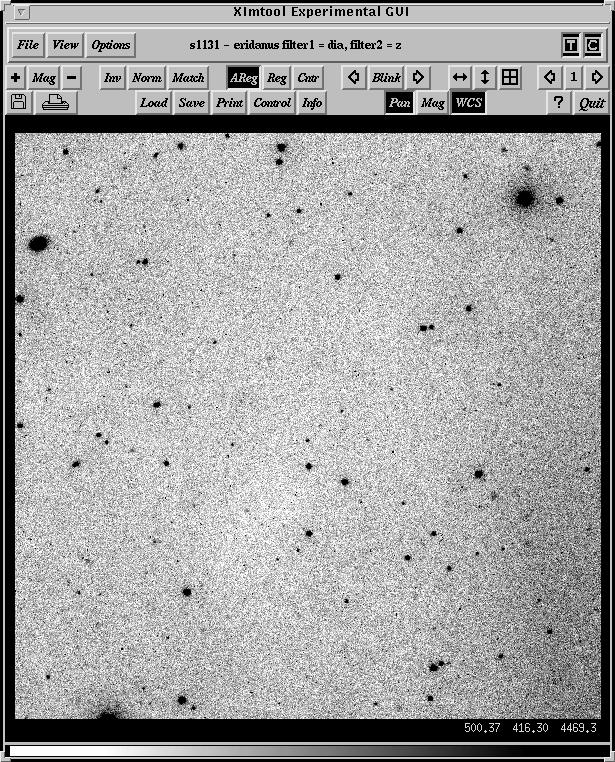
and here is the same image after defringing. The fringe frame was made by a simple median of all the long z exposures.
I averaged all the residuals for the 3 nights to look for trends. There were a few trends that are worrisome.
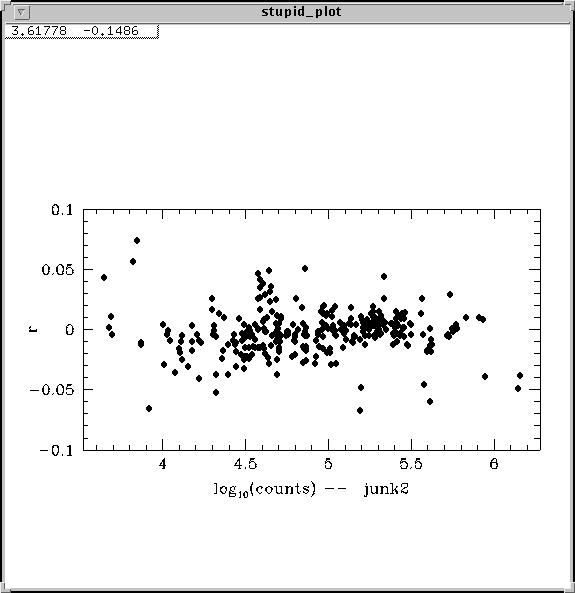
The next plot shows the residuals (O-C) of the Landolt standards. plotted against log10(counts). There is a small but real trend from 10**4 to 10*6 counts of about 0.015mag over this range.
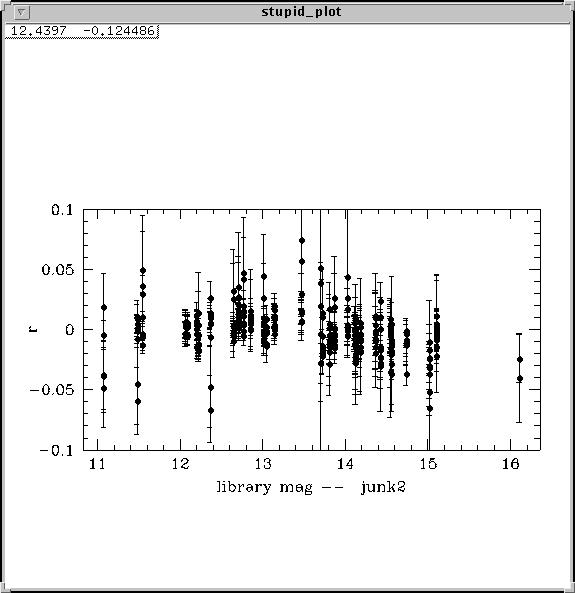
Doing the same plot against the library magnitude:
There was no obvious trend against x-direction, but in the y direction, one could see about a 0.02mag (full range) change in mag from the edge to center, in the sense that O was brighter than C:
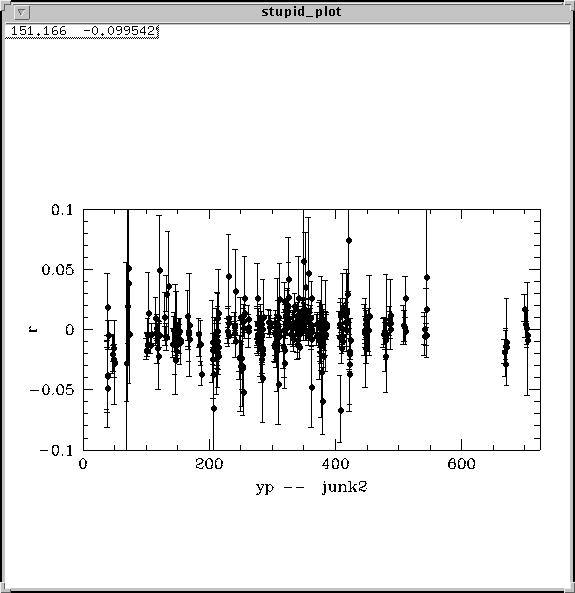
These data, remember, are the central 1500 pixels. Evidently there is still a small amount of vignetting.
At this point, I am not going to take out the effect, but it looks real.


