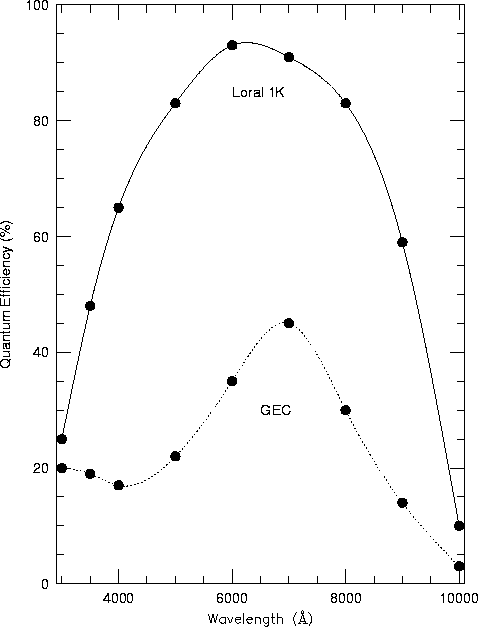


The quantum efficiency of the Loral 1K measured in the lab is given in Table 7 and shown in Figure 6. Also given is the quantum efficiency for the GEC CCD that the Loral 1K replaced; the Loral 1K offers a 2-3x gain in quantum efficiency over the GEC at most wavelengths.

Table 7: Quantum efficiency of the Loral 1K and GEC CCDs
|
Wavelength (A) |
Quantum Efficiency (%) |
|
| Loral 1K | GEC | |
| 3000 | 25 | 20 |
| 3500 | 48 | 19 |
| 4000 | 65 | 17 |
| 5000 | 83 | 22 |
| 6000 | 93 | 35 |
| 7000 | 91 | 45 |
| 8000 | 83 | 30 |
| 9000 | 59 | 14 |
| 10000 | 10 | 3 |
Efficiency measurements of the complete telescope/spectrograph/CCD combination using observations of spectrophotometric standard stars were obtained with gratings 09 and 32 on engineering nights in 1995 November. The results are given in the Table 8 and Figure 7 in terms of the percentage of photons striking the telescope primary mirror which are eventually detected. Also given in Table 8 and Figure 7 are the estimated efficiencies for gratings 11 and 13 that are obtained by scaling the measured system efficiencies with the GEC CCD by the ratio of the Loral and GEC quantum efficiencies.
Table 8: System Efficiency of the 1.5-Meter Cassegrain Spectrograph with Gratings 09, 32, 11 and 13
| Wavelength | System Efficiency | |||
| 09 | 32 | 11 | 13 | |
| 3000 | 0.0 | 1.4 | ||
| 3500 | 7.5 | 0.5 | 4.0 | |
| 4000 | 13.5 | 3.4 | 7.6 | |
| 4500 | 16.5 | |||
| 5000 | 17.0 | 8.3 | 10.2 | |
| 5500 | 16.0 | |||
| 6000 | 13.5 | 18.6 | 13.0 | |
| 6500 | 10.0 | 14.8 | ||
| 7000 | 13.6 | 12.9 | 7.3 | |
| 7500 | 11.8 | |||
| 8000 | 8.5 | 9.9 | 5.5 | |
| 8500 | 6.5 | |||
| 9000 | 5.0 | 6.3 | 2.9 | |
| 9500 | 2.9 | |||
| 10000 | 1.3 | 0.0 | ||