

With the old GEC CCD there was no evidence that the resolution of the spectrograph was limited by either the camera optics or the MTF of the detector. The measured FWHM of comparison lines corresponded very closely to the projected width of the spectrograph slit down to the Nyquist sampling limit, and 2 pixel FWHM resolution was routinely achieved. There was little variation of image quality with position on the chip, or with wavelength.
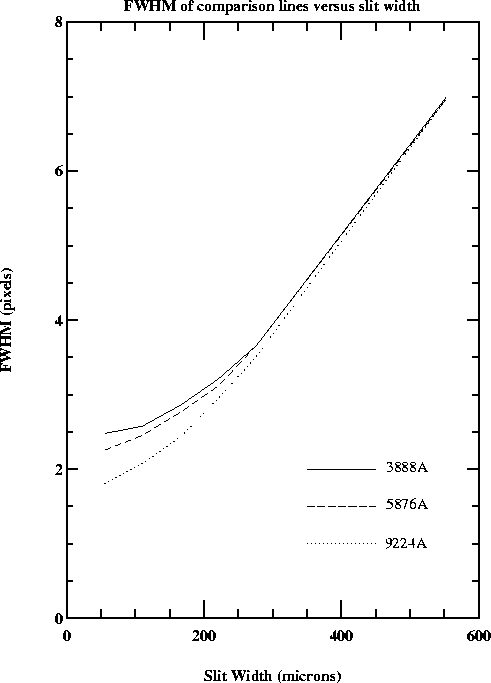
The Loral 1200x800 CCD now in use with the 1.5-m Cassegraon spectrograph has 15micron pixels and is 1.4 times longer than the GEC. Because of the finer sampling and larger size of this CCD it is expected that the camera optics will somewhat limit the resolution, especially at the extreme edges of the field. In addition at KPNO they have been unable to get images better than ~3 pixel FWHM with their Loral chips. This has been attributed to diffusion of photoelectrons within the CCD. This effect is greatest at blue wavelengths since higher energy photons are absorbed closer to the front surface of the CCD. Figure 3 shows the FWHM for spectral lines at the center (in X and Y) of the Loral 1K CCD as a function of the slit width; curves are shown for 3 wavelengths: 3888A, 6678A and 9224A.
Figure 3: FWHM as function of slit width for the Loral 1K CCD

The upper right amplifier of the Loral 1K does not perform satisfactorily, therefore this CD is read in single-channel mode (through the lower left amplifier). Full well ( $118,000e-) is reached before the ADC saturates at the higher gains settings (those having smaller values of e-/ADU). The non-linearity (peak-to-peak gain variation) is excellent (< 0.26%) for levels below full well or ADC saturation. The dark current is 4.25e-/pixel/hour.
Table: ARCON 3.9: Loral 1K (1200x800)
| Gain | Slope | 1/G | RON | Read Time | ||
| Index | (micro sec) | (e-/ADU) | (e-) | (sec) | ||
| LL | LR | LL | LR | |||
| 1 | 5 | 4.11 | 0 | 10.3 | 0 | 25.1 |
| 2 | 7 | 2.87 | 0 | 7.6 | 0 | 29.1 |
| 3 | 10 | 2.05 | 0 | 7.2 | 0 | 35.3 |
| 4 | 14 | 1.42 | 0 | 6.9 | 0 | 43.4 |
| 5 | 20 | 0.96 | 0 | 6.5 | 0 | 55.6 |
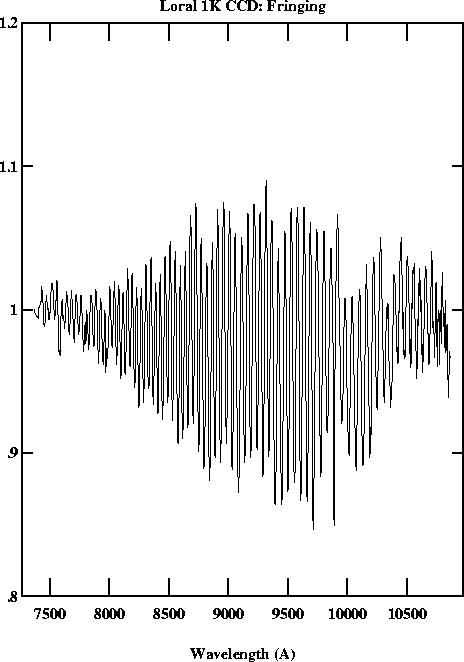
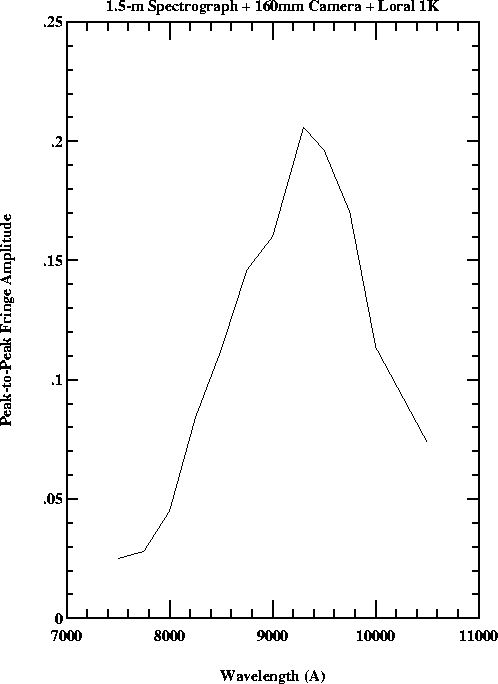
The Loral 1K CCD fringes with a substantial amplitude at wavelengths longer than 7500A (Figure 4). However, thanks to the lack of significant flexure in the 1.5-meter Cassegrain spectrograph and camera (Table 6), it is possible to remove nearly all of the fringing using normal dome flats. The fringes on the Loral 1K run approximately perpendicular to the dispersion. The peak-to-peak amplitude and fringe spacing are given in Table 5 and shown in Figure 11.
Figure 4: Fringes in the red with Loral 1K CCD

Table 5: Fringe Amplitude and Spacing with the Loral 1K CCD
|
Wavelength (A) |
Amplitude (%) |
Spacing (A) |
| 7500 | 2.5 | 38 |
| 7750 | 2.8 | 40 |
| 8000 | 4.5 | 40 |
| 8250 | 8.4 | 46 |
| 8500 | 11.3 | 38 |
| 8750 | 14.6 | 42 |
| 9000 | 16.0 | 54 |
| 9300 | 20.6 | 54 |
| 9500 | 19.6 | 56 |
| 9750 | 17.0 | 66 |
| 10000 | 11.4 | 50 |
| 10500 | 7.4 | 60 |
Figure 5: Amplitude of fringes versus wavelength for the Loral 1K CCD

Table 6: The displacements (in pixels) due to flexure parallel and perpendicular to the dispersion as a function of Hour Angle and Declination.
| Parallel to Dispersion | |||||||
| Declination | |||||||
| West | East | ||||||
| +30 | 0h.0 | ||||||
| +0.10 | |||||||
| 0 | 3h.0 | 0h.0 | 3h.0 | ||||
| +0.35 | -0.16 | -0.23 | |||||
| -30 | 4h.5 | 3h.0 | 1h.5 | 0h.0 | 1h.5 | 3h.0 | 4h.5 |
| +0.75 | +0.42 | +0.14 | 0.00 | -0.09 | -0.10 | -0.06 | |
| -60 | 5h.0 | 0h.0 | 5h.0 | ||||
| +0.79 | +0.13 | -0.06 | |||||
| -90 | 0h.0 | ||||||
| +0.68 | |||||||
| Perpendicular to Dispersion | |||||||
| Declination | |||||||
| West | East | ||||||
| +30 | 0h.0 | ||||||
| +0.10 | |||||||
| 0 | 3h.0 | 0h.0 | 3h.0 | ||||
| -0.66 | +0.08 | -0.23 | |||||
| -30 | 4h.5 | 3h.0 | 1h.5 | 0h.0 | 1h.5 | 3h.0 | 4h.5 |
| -0.75 | -0.61 | -0.29 | 0.00 | +0.26 | +0.34 | +0.37 | |
| -60 | 5h.0 | 0h.0 | 5h.0 | ||||
| +0.81 | -0.10 | +0.40 | |||||
| -90 | 0h.0 | ||||||
| -0.49 | |||||||