Starting on May 7, 2004, three MASS turbulence profilers were in simultaneous use at Cerro Tololo, Chile, as a part of intensive campaign of inter-comparison of site-testing equipment ( more on that campaign ). The MASS instruments are:
Meade MASS-DIMM installed in the Tololo DIMM tower and fed by the Meade telecope. Outer aperture diameter 80 mm, yellow filter.
TMT MASS-DIMM installed on the Halfmann telescope nearby. Outer aperture 85 mm, no filters. By removing the filters, we gain a factor of ~3 in flux on blue stars, but become more sensitive to the knowledge of spectral response and stellar spectral energy distribution.
Old MASS in the USNO dome, fed by its own off-axis reflecting telescope. Outer aperture diameter 130 mm. That instrument has been expensively used until September 2003, it was compared with SCIDAR in October 2002.
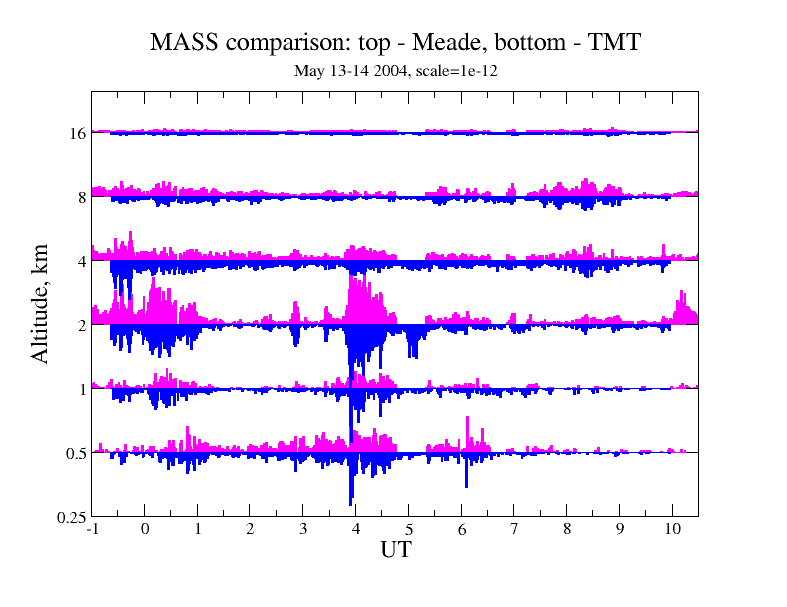
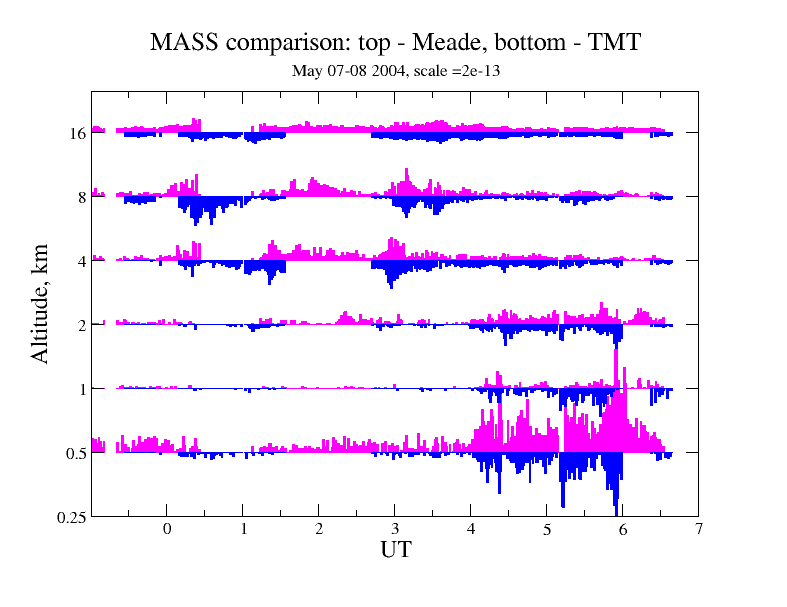
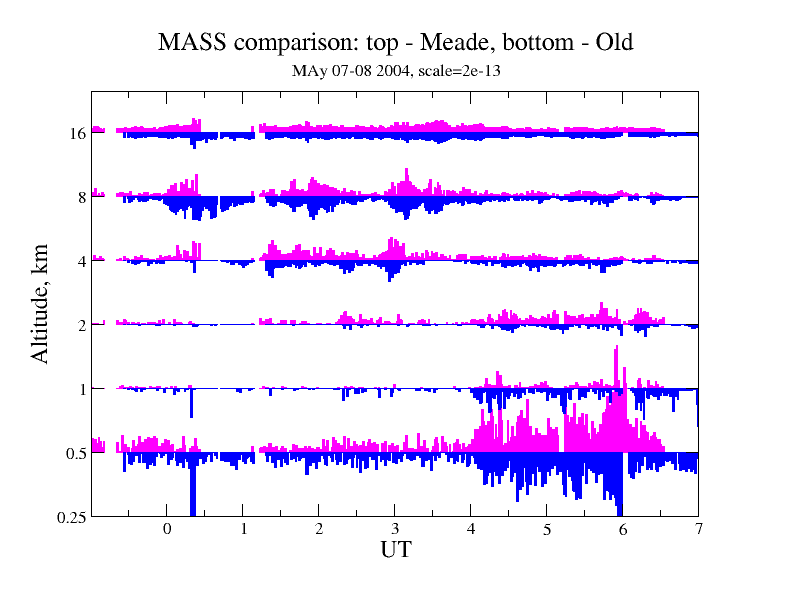
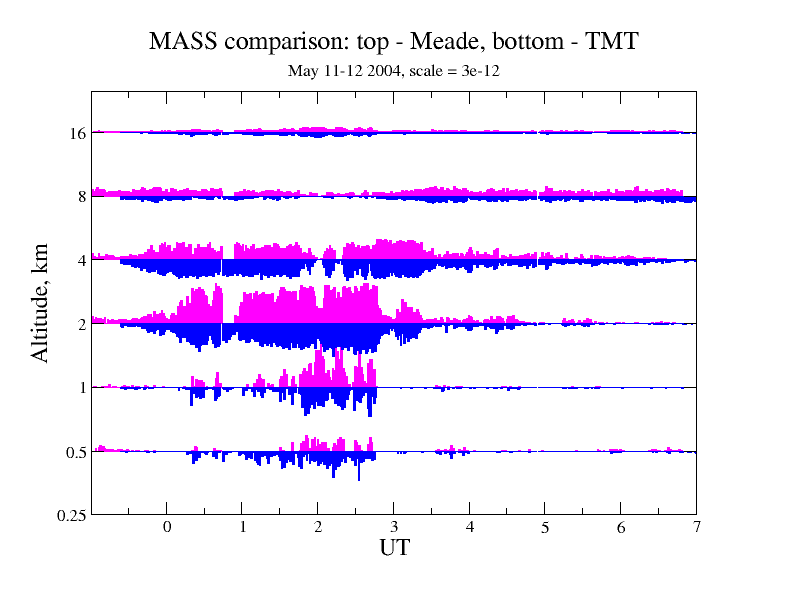
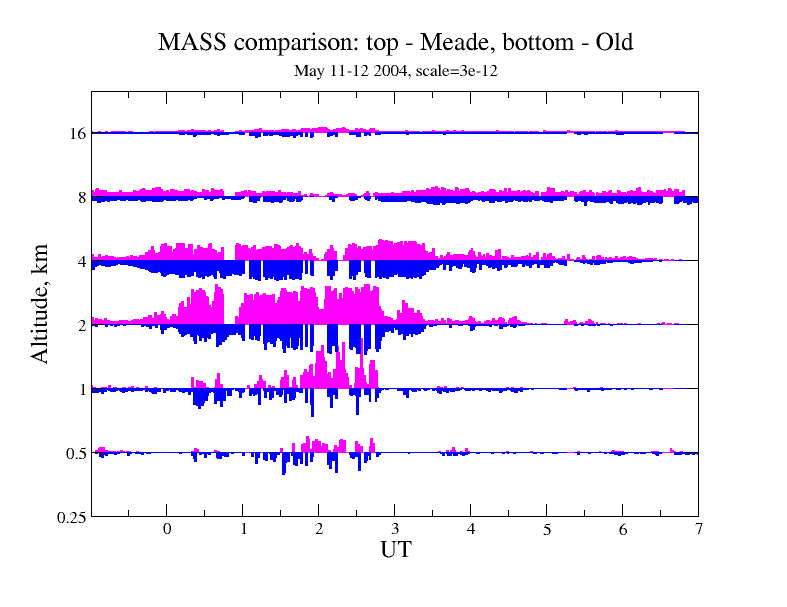
Pictures below show the bar-plots of Cn2 integral in 6 pre-defined layers as a function of UT time. The length of bars that corresponds to the layer separation is called "scale". Upper halves of the bars (magenta) come from one MASS instruments, lower halves (blue) - from other instrument. If two MASS instruments were in perfect agreement, the magenta and blue parts will be mirror-reflection of each other. Gaps in the data are caused by star pointing or other technical reasons. All instruments looked at the same stars.
A night of May 07/08 2004 with very calm upper atmosphere (free-atmosphere
seeing of 0.2"-0.3"). Scale 2e-13 m^{1/3}.
A night of May 11/12 2004 with VERY strong turbulence. Note that the
scale is 3e-12 m^{1/3} - an order of magnitude larger compared to the
previous plots.
A night of May 13/14 2004: typical turbulence. The old MASS was not workig,
but the Meade and TMT MASS instruments demonstrate excellent agreement.