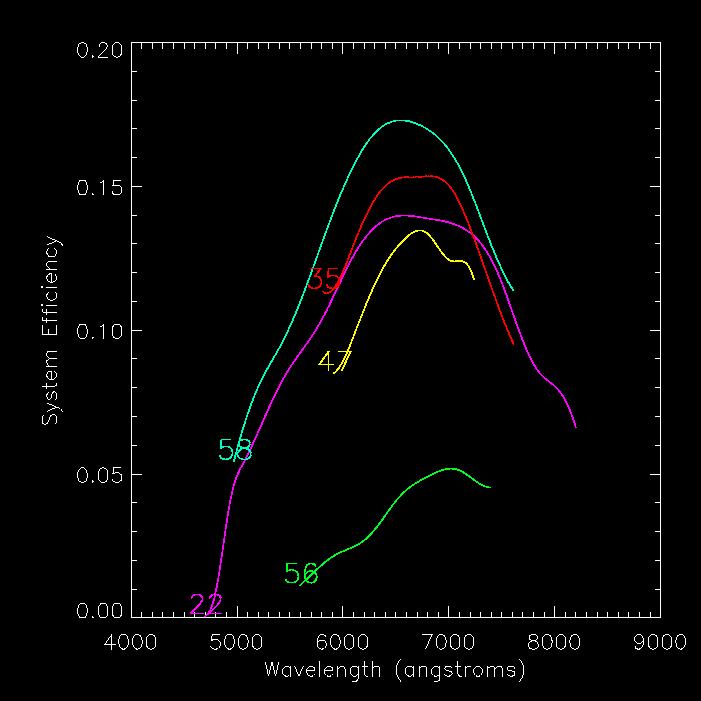
Plot of the efficiency of the 1.5-m R-C spectrograph (percentage of photons striking the primary that are detected) versus wavelength for four low-dispersion gratings (13, 11, 09 and 32).
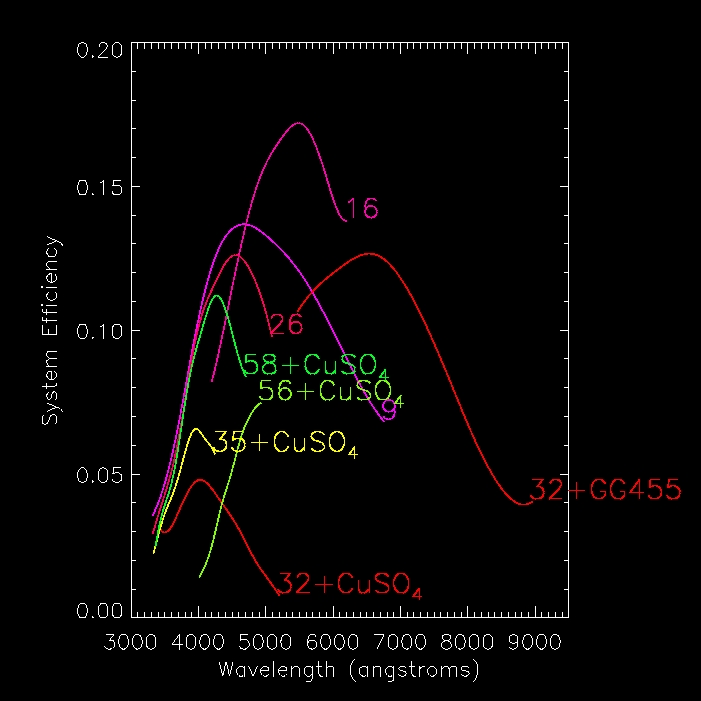
System efficiencies measured February 2002
System efficiencies measured in November 1996
Source URL (modified on 08/04/2020 - 09:51): http://www.ctio.noao.edu/noao/content/15m-R-C-System-Efficiency-plots