[Main Index]
| The OSIRIS User's Manual
[Main Index] |
Known OSIRIS Problems (or "Features") |
![[Scales of Judgement]](scales.jpg) |
20 July 2000. The new array installed in December 1999 does not exhibit the unstable shading of the previous array. Therefore, we recommand that no line-by line bias subtraction be done.
20 July 2000. A new array was installed in OSIRIS in 1999 December. The bias discontinuity has been greatly diminished.
Slit position changes on array (15 January 2001)
The apparrent y pixel position of the slit appears to change on the
array when the telescope is moved. It is not clear if this is just a
worse
than normal flexure or if the acquistion mirror is not repeating its
position
well (something may be loose). Tests with the telescope in one position
and repeated flips of the acquisition mirror indicate it reproduces its
position to +/- 0.1 pixel. We will derive a new flexure map on the next
engineering run. Until this problem is resolved, observers should pay
more
attention to the slit position (we recommend checking it on each new
object).
The full range of movement reported by observers is about 4 pixels.
Sticking
of the CAMFOCUS mechanism (01
July 2004)
The CAMFOCUS mechanism which is used to make a best focus of the
OSIRIS optical train has been sticking. The mechanism will occasionally
either not move at all (though the motor is asserted) or will move but
not properly initialize to its home position (these could be
independent problems). As of early July, the mechanism appears to be
behaving.
Update
(12 April 2008)
When a camera is changed using the Prospero command
pr> camera n
where n=0-3, the camera turret rotates to change the camera and performs an automatic camfocus reset. Sometimes after a camera change one receives the following error message in the Prospero window:
pr> camera n
Setting camera...
pr> camfocus 500
Setting camfocus...
pr> camera m
Setting camera
Error: Command returned error
ERROR: Aborting motion: Total step limit exceeded.
Error: Could not reset camfocus to home position
Execution error in Prospero command.
Command: camera m
This signifies that during the camera change, the camfocus reset exceeded its low limit switch and should not be moved via Prospero commands, i.e., repeating
pr> camfocus 0 reset
commands. This will only drive the camfocus mechanism further past the low limit switch, resulting in a physical collision in which the instrument will have to be warmed and opened to fix.
The current accepted procedure to recover from the initial error is to
offset the camfocus mechanism via commands to the IE from the ISIS window
as shown below.
IS% >IE mstatus camfocus
IS% IE> STATUS: MechNum=7 Address=6 EncBits=0000101100000000
Position=INVALID Current=255 StepDelay=2200
IS% >IE setadr 6
IS% IE> DONE: Address=6
IS% >IE offset 2000
IS% IE> DONE: Offset completed.
IS% >IE mstatus camfocus
IS% IE> STATUS: MechNum=7 Address=6 EncBits=0000101100000000
Position=INVALID Current=255 StepDelay=2200i
IS% >IE offset 2000
IS% IE> ERROR: Aborting motion: Hi limit encountered.
IS% >IE mstatus camfocus
IS% IE> STATUS: MechNum=7 Address=6 EncBits=0010100100100000
Position=HILIMIT Current=255 StepDelay=2200
Notice that at the first mstatus command the camfocus posistion is "INVALID". After the second offset command, the camfocus has been moved to its high limit and the camfocus posistion is no longer INVALID. At this stage, it should be possible to return to the Prospero window and issue a camfocus 0 reset command to home the camfocus mechanism with success. If in doubt about the procedure, please contact the Instrument Scientist.
Scrambled Images (07 September 2006)
The fiber run at SOAR may be long enough that image transfer is compromised if the fiber throughput is degraded. The fibers should be checked for transmission each time they are reconnected. The September 06 values show good transmission for test signals of 22mV degradation or less. 22.8 mV is too low and has been shown to result in lost data and therefore bad images.
Careful tests suggest the fringes move when the slit mechanism or flip mirror are moved. This means a small movement of the slit image results in a shifted fringe pattern.
A possible solution is to "dither" the grating by a small amount when taking flats. This will produce a combined flat with no fringes. Division of the flat into data taken through out the night can then be used to fit fringes and remove them. Dithering the grating for both data and flats may be the best way to remove fringes, but will require more work in software to reduce.
It is not recommended to take spectra of bright objects which require the minimum exposure time (3 sec). The reason is that the dispersion direction is perpendicular to the fast read pixel direction and thus the OSIRIS readout can be up to 3 sec different for parts of the spectrum. This is enough that seeing changes can affect the amount of light through the slit for different parts of the spectrum. This problem appears possibly more significant at SOAR than at the Blanco, and it is not clear if part of the issue is guiding rather than seeing excursions. Please use fainter telluric standards which require longer exposure times (7-8th mag, 30-60 sec) so that the read time is a small fraction of the total exposure. Uniform surface brightness dsitributions are not affected.
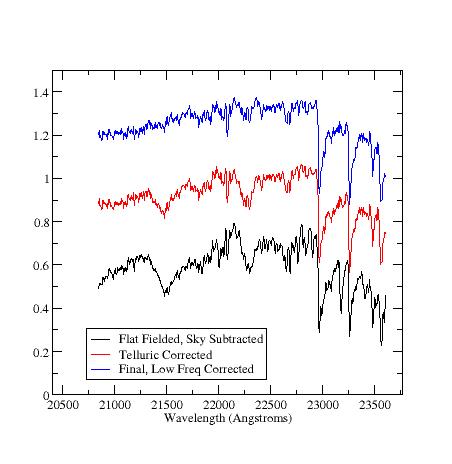
Low Frequency "Fringing" in K band Spectra (July 2011, rblum@noao.edu)
Low frequency "fringes" appear in OSIRIS low and high dispersion K band spectra at times. The cause is not known, but appearance of this feature appears to have happened sometime after moving to SOAR from the Blanco. The features are known to be present in spectra taken in 2007 and up to the present time. The cause is unknown, but the features can be removed to a significant degree in data reduction. Similar fringes may occur in the J and H bands, but this has not been seen so far in our tests, nor have we received comments from users that this is the case.
The fringes may appear any time during a night's observation, or not. The best way to handle the fringes is to take frequent standard star observations through out the night. Taking multiple observations of the same star druing the night spread out over several hours will usually allow for spectra with and without the fringes. This allows one to make a ratio of the two observations and create a fringe map. Even observations of similar type standards can be used in the case where the same star is not observed more than once (for example, early type OAB stars which are mostly featureless in the near infrared).
The proscription for removing the fringes is simple. Ratio observations of the same star or similar type stars taken at different times. One star should be selected that shows fringes and the other that does not. Smooth this ratio by a large number of pixels (e.g. 30), and save the result. Normalizing the continuum to unity can also be done if desired. Then reduce object spectra in the normal way incuding telluric correction. There are at least three cases:
1) No fringing appears in either object or telluric. No further correction needed.
2) Fringing occurs in both object and telluric. No correction needed if amplitude is same in both.
3) Fringes occur in one or the other of object or telluric (or with different amplitude). Follow the steps below.
If a resultant low frequency fringe appears in the telluric corrected object spectrum:
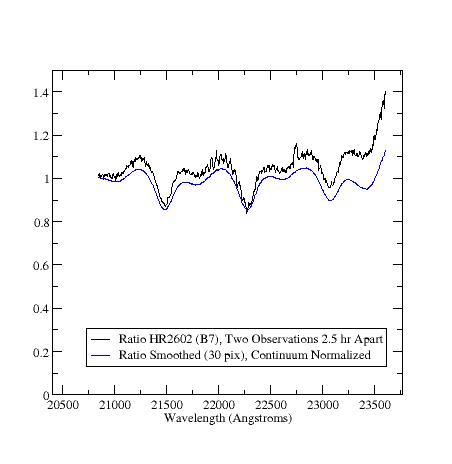
a) Find similar observations of telluric stars with and without fringing (ideally the same star observed at different times) and make a ratio. Smooth this ration by 30 pixels and save as "fringeRatio". Depending on whether fringes appear in your object or telluric, the resulting spectrum with show the fringe pattern as "emission" or "absorption." make two ratios to cover both cases as needed.
b) Execture the IRAF procedure "telluric" with the original telluric corrected spectrum and the fringe spectum (as the standard in this case).
cl> telluric object output fringeRatio
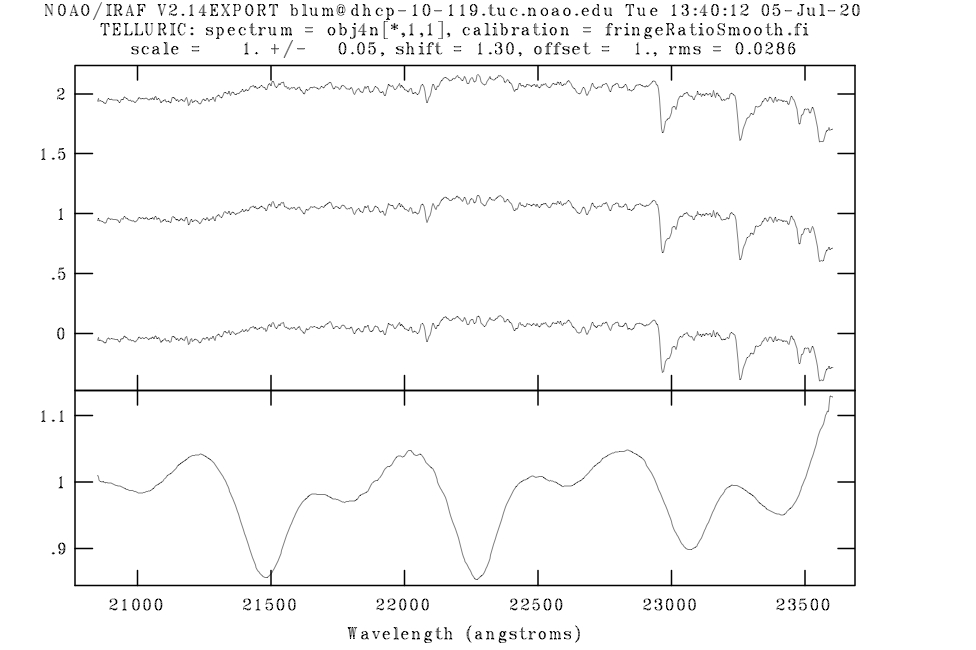
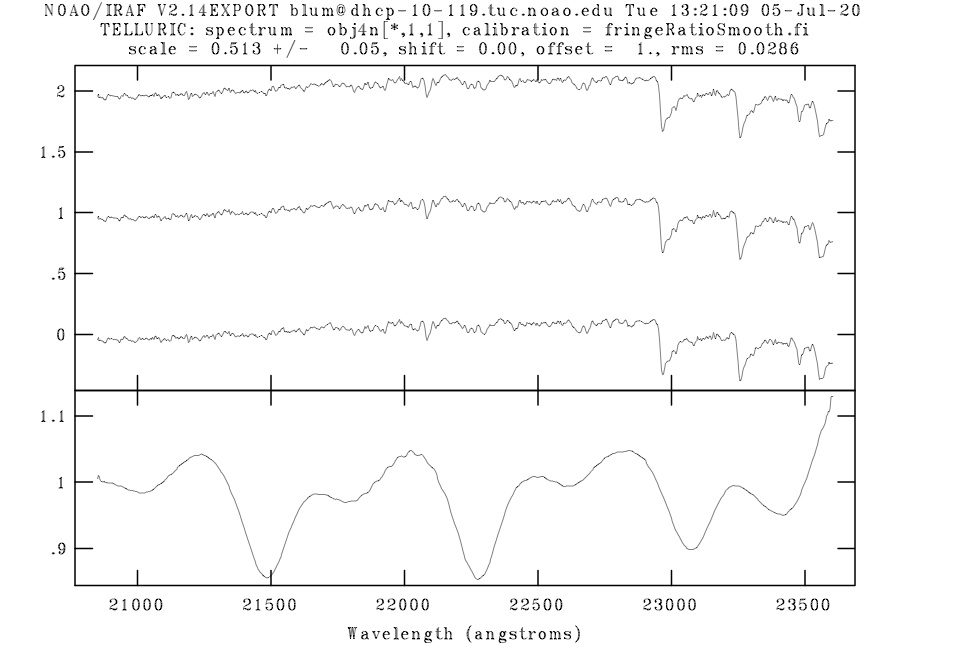
c) Use the interactive feature of telluric to increase or decrease the strength of the correction given by "fringeRatio." This is done by using the "y" key stroke on the interactive display. There are three corrected spectra shown (and the fringeRatio below). These show the current correction (middle) and a slightly undercorrected (bottom) spectrum and over corrected (top) spectrum. By clicking "y" on the top spectrum, the strength of correction is increased, and by clicking "y" on the bottom it is decreased. The middle spectrum shows the current "result". Similarly, the fringeRatio can be shifted in wavelength by hitting "x" on the top and bottom spectra. Large shifts should not be needed (there is also a xcorrelation option in telluric which will try to figure the shift automatically). Use your eye to decide the best scaling, or alternately be guided by the interactive read out showing the RMS in the top right corner. When satisfied, hit "q" to quit.
Sample results are shown here:
Ratio of two observations of the same source (B7 telluric standard) and smoothed ratio.
Screen grab of telluric IRAF procedure being used to make fringe correction. This plot shows the IRAF telluric panel without any scaling (initial ratio, scale =1.0). This plot shows the same session after adjusting the scaling using the "y" keystroke (final spectrum is in the middle, scale =0.51). Read the telluric help page in IRAF for detailed instructions.