[PostScript version (980Kb)]
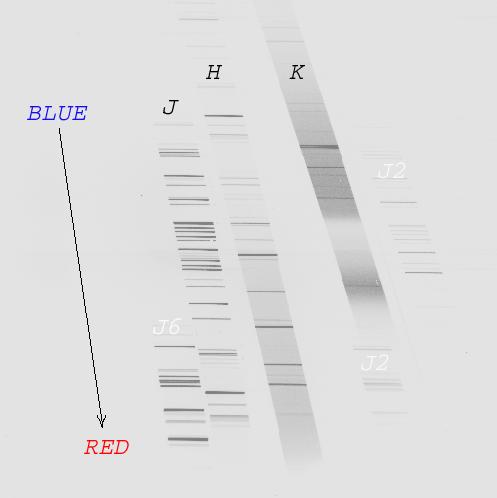
The image above shows a cross-dispersed spectrogram showing the mapping of
the orders across the full array at the optimal grating tilt (950 encoder
steps). The spectrum is of the 4m HeNeAr comparison lamps.
The three primary orders (n=3-5 representing K, H, and
J-bands, respectively) are marked, as are lines from extraneous orders
(e.g., J-band lines from the 6th order of the grating at the lower left,
and the lines from the 2nd order of the grism on the right).
The orientation of the image above is as it would appear on in an IRAF
ximtool or SAOimage (origin at lower-left corner). The data-acquisition
PC's real-time display is inverted (origin at the upper-left corner).
The optimal grating tilt to center the 3 primary orders (JHK) within the
imaging window of the array is TILT=950.
Updated: 1999 December 21 [rwp]